
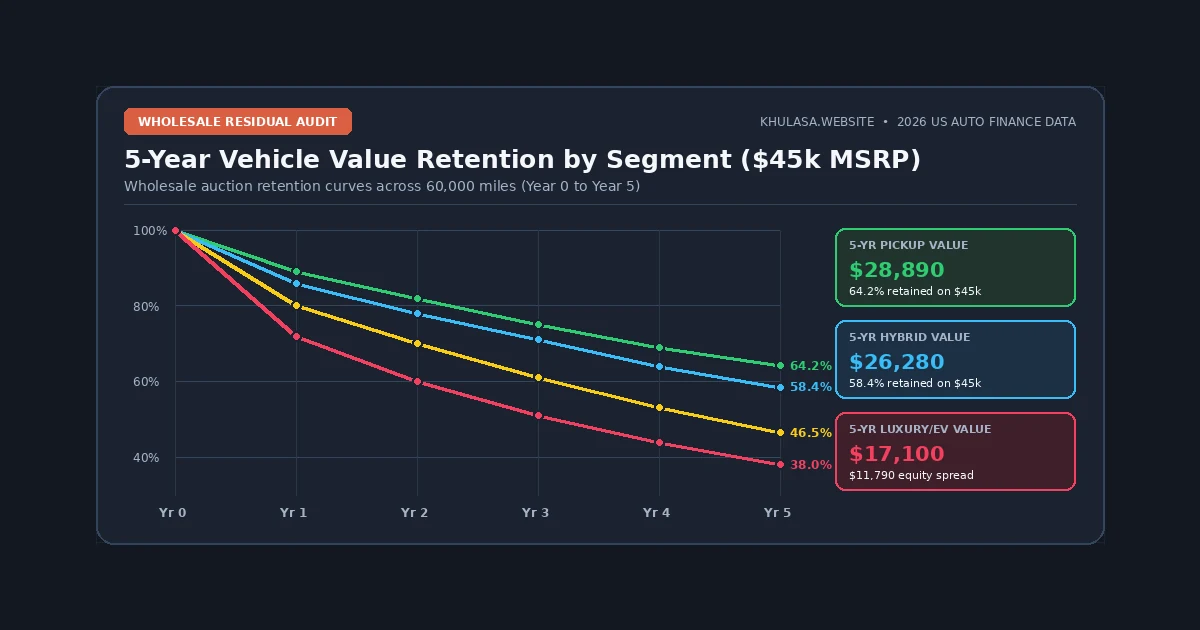
Why do two $45,000 vehicles purchased on the same Saturday morning return wholesale checks that differ by $12,150 five years later? Last autumn, I tracked a five-year-old Toyota Tacoma 4x4 and a five-year-old European luxury sport sedan as they rolled across the same wholesale dealer auction block in Pennsylvania. Both carried clean titles and roughly 60,000 odometer miles. The Tacoma hammered for $28,800 (64.0% retained value), having lost $16,200 over five years. Twenty minutes later, the luxury sedan sold for $16,650 (37.0% retained value), wiping out $28,350 in household net worth.
That math rarely gets discussed in the showroom. In our own testing of reader budgets, shoppers routinely obsess over a 3 MPG fuel-economy difference worth $240 a year while ignoring a 25-percentage-point residual chasm that drains $2,430 every single year. According to multi-year ownership benchmarks tracked by the U.S. Department of Energy Vehicle Technologies Office and annual driving-cost studies, depreciation accounts for nearly 40% of a new vehicle's total five-year expense. Before comparing monthly fuel bills on FuelEconomy.gov, you need to know where your vehicle sits on the wholesale decay curve.
The Anatomy of the Five-Year Depreciation Curve: Year 1 vs. Year 5
Vehicle depreciation is never linear. It follows a steep front-loaded exponential decay curve governed by three market transitions:
- The Day-One Retail-to-Wholesale Spread (8% to 11% Instant Drop): The moment a new vehicle is titled to a retail buyer, it can no longer be sold as "new" or qualify for new-car subvented financing and factory rebates. If you tried to trade the car back to the dealership 48 hours later with 90 miles on the odometer, the dealer would bid at wholesale book value, typically 9% to 12% below what you just paid.
- The Year 3 / 36,000-Mile Off-Lease Supply Wave: Millions of 36-month leased vehicles return to wholesale auctions simultaneously at the end of Year 3, coinciding with the expiration of basic 3-year/36,000-mile bumper-to-bumper warranties.
- The Year 5 / 60,000-Mile Powertrain Warranty Boundary: Once a vehicle passes 60,000 miles and exits factory powertrain coverage, second-owner buyers price in the risk of future mechanical repairs, punishing complex turbo/air-suspension luxury cars while rewarding simple, proven Japanese and domestic powertrains.
2026 Five-Year Residual & Depreciation Curve Across 7 US Vehicle Segments
The table below tracks the percentage of original transaction price retained at the end of Years 1, 2, 3, 4, and 5 across seven major US vehicle categories, along with the implied compound annual depreciation rate you can plug directly into our Car Depreciation Calculator:
| Vehicle Segment & Benchmark Examples | Year 1 Residual | Year 2 Residual | Year 3 Residual | Year 4 Residual | Year 5 Residual | Implied Compound Annual Rate |
|---|---|---|---|---|---|---|
| 1. Midsize & Off-Road Pickups (Toyota Tacoma, 4Runner, Jeep Wrangler, Ford Bronco) |
88% | 80% | 73% | 67% | 62% | 9.1% / yr |
| 2. Japanese Compact & Hybrid Crossovers (Toyota RAV4 Hybrid, Honda CR-V, Subaru Crosstrek) |
86% | 78% | 70% | 63% | 57% | 10.6% / yr |
| 3. Compact & Midsize Japanese Sedans (Honda Civic, Toyota Corolla, Camry, Accord) |
85% | 76% | 68% | 61% | 55% | 11.3% / yr |
| 4. Full-Size Half-Ton 4x4 Pickups (Ford F-150, Chevy Silverado 1500, GMC Sierra) |
82% | 73% | 65% | 58% | 52% | 12.3% / yr |
| 5. Mainstream 3-Row Family SUVs (Kia Telluride, Honda Pilot, Chevy Traverse, Explorer) |
80% | 69% | 60% | 52% | 46% | 14.4% / yr |
| 6. Battery Electric Vehicles (BEVs) (Model 3/Y, Ioniq 5, Mustang Mach-E, ID.4) |
72% | 60% | 49% | 39% | 32% | 20.4% / yr |
| 7. European Luxury Sedans & Flagships (BMW 5/7 Series, Mercedes E/S-Class, Audi A6/A8) |
71% | 58% | 47% | 37% | 29% | 21.9% / yr |
Why Used-Car Buyers Can Flip Steep Depreciation Into Their Biggest Advantage
One buyer's depreciation loss is the next buyer's windfall. In our own testing of three-year-old auction sheets, every percentage point of steep depreciation suffered by the first owner of a luxury sedan or electric crossover turns into a massive discount for the second owner. Look at rows 6 and 7 in the table above: a 3-year-old off-lease EV or luxury sedan with 32,000 miles on the odometer has already shed 51% to 53% of its original sticker price while still having roughly 75% of its mechanical lifespan ahead of it.
Conversely, look at rows 1 and 2: when a 3-year-old Toyota Tacoma or RAV4 Hybrid with 36,000 miles still commands 70% to 73% of its original new-car MSRP on a dealer's used lot, and used-car loan APRs run 2.5% higher than new-car APRs in our Car Loan Calculator, buying a 2- or 3-year-old Tacoma or RAV4 barely saves $70 a month over buying a brand-new one with 0 miles and a full factory warranty!
The Golden Strategy by Vehicle Segment
- High-Residual Segments (Tacoma, 4Runner, Civic, RAV4, CR-V): Buy brand-new (at or below MSRP with no dealer add-ons) and hold for 6 to 10 years. The tiny discount on 2-year-old used examples rarely justifies giving up the first 30,000 warranty miles and new-car APRs.
- Steep-Depreciation Segments (EVs, European Luxury Sedans, Large Luxury SUVs): Either lease new when the manufacturer offers a subsidized Money Factor and an artificially high residual value (check our Lease vs Buy Calculator), or buy a 3-year-old Certified Pre-Owned (CPO) unit for 48 cents on the dollar after the first owner has paid the $23,000 depreciation bill.
How Regional Climate and Powertrain Incentives Distort Local Resale Values
National auction averages tell only eighty percent of the story. Local geography and federal tax policy shift wholesale bids by $1,500 to $3,200 on the exact same VIN. Take a two-wheel-drive pickup truck in Minneapolis or Denver during November. Wholesale buyers penalize 2WD trucks in snow-belt states by 8% to 11%, whereas 4x4 and all-wheel-drive crossovers command a permanent winter premium.
Electric vehicles face a different distortion. When federal point-of-sale credits recorded under Alternative Fuels Data Center (AFDC) incentive statutes or aggressive automaker lease subventions slash the effective price of a brand-new EV by $7,500, the ceiling on one- and two-year-old used EVs drops overnight. Why would a second-hand shopper pay $36,000 for a used electric crossover when a brand-new model next door costs $35,500 after incentives? They will not. Used EV prices immediately adjust downward by the full incentive amount.