
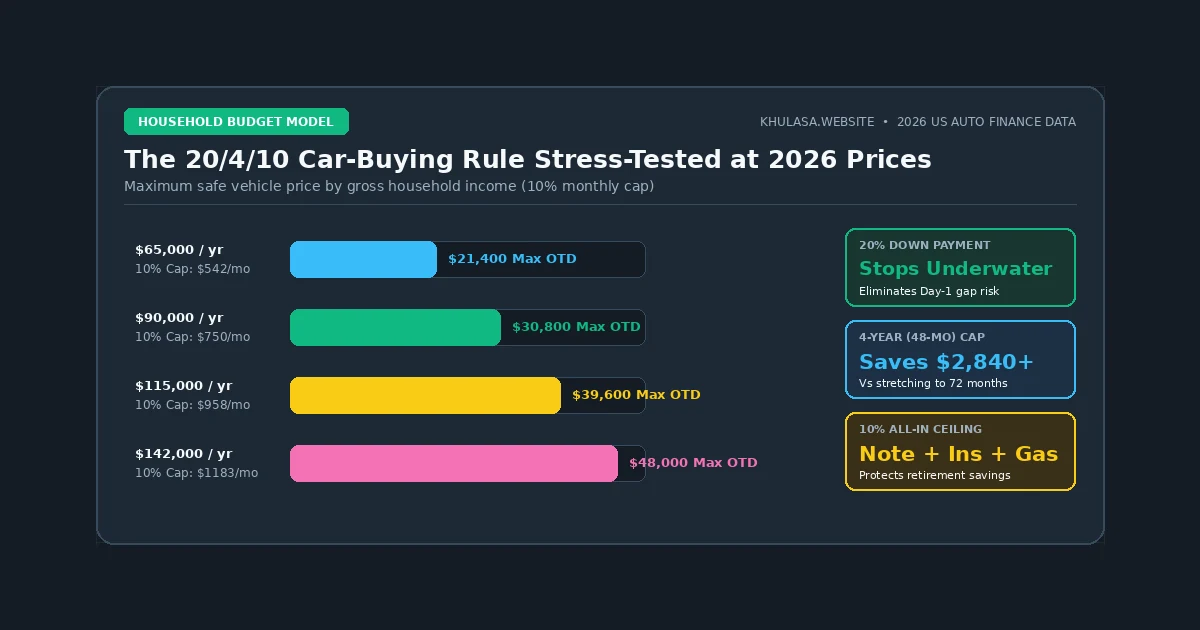
How much household income does it actually take to afford an average $48,000 new car in 2026 without starving your retirement accounts? Personal finance textbooks still repeat a simple three-number benchmark known as the 20/4/10 Rule: put at least 20% down in cash or trade-in equity, finance the balance for no more than 4 years (48 months), and cap your total monthly vehicle expenses (loan payment, insurance, and fuel) at 10% of gross monthly income.
The math hits hard when applied to 2026 showroom stickers. Today, the average new-vehicle transaction price hovers near $48,000, full-coverage auto insurance averages $185 a month, and prime auto loan rates sit between 6.25% and 6.75% APR according to Federal Reserve G.19 consumer credit data. When Elena and I ran a $48,000 purchase through the strict 20/4/10 formula alongside Bureau of Labor Statistics Consumer Expenditure Survey transportation benchmarks, the required household income came out to a staggering figure:
- 20% Down Payment on $48,000 (plus ~$3,600 tax & fees paid upfront): Requires $13,200 in upfront cash.
- 48-Month Loan on the Remaining $38,400 at 6.35% APR: Produces a monthly loan payment of $908.05/month.
- Add $185/month Insurance + $135/month Fuel: Total monthly car outlay hits $1,228.05/month.
- Gross Income Required so $1,228.05 is ≤ 10% of Income: $12,280.50/month ($147,366 per year), nearly double the US median household income!
Does that mean the 20/4/10 rule is obsolete? Not at all, the math hasn't broken; what broke is the American habit of treating a $48,000 leather-lined SUV as a middle-class baseline necessity.
Why Each Pillar of the 20/4/10 Rule Exists
I see this mistake every week when reviewing household budgets. Before adjusting any of the three numbers in our Car Affordability Calculator, understand the specific financial hazard each number was designed to prevent:
- The 20% Down Payment Pillar (Prevents Negative Equity): A new car loses 9% to 11% of its value the day it leaves the dealership and 16% to 20% by the end of Year 1. Putting 20% down guarantees that you have positive equity from Day 1, eliminating the need to buy GAP insurance and allowing you to sell or trade the car at any time if your job or family situation changes.
- The 4-Year / 48-Month Term Pillar (Caps Interest & Aligns With Warranty): A 48-month loan forces rapid principal paydown and guarantees that your loan is paid off while the powertrain is still under factory warranty and before the 60,000-mile tire/brake/fluid cliff arrives.
- The 10% Income Cap Pillar (Protects Retirement & Housing Cash Flow): Because cars are depreciating consumption assets, unlike a home or an S&P 500 index fund, capping total transportation costs at 10% to 12% of gross income leaves room for a 15% retirement savings rate and a 28% housing ratio.
2026 Household Income to Max Car Price Table: Strict 20/4/10 vs. Modern 20/5/12
In 2026, because modern vehicles regularly last 12 to 15 years (160,000+ miles) when maintained properly, extending the loan term from 48 months to 60 months (the 20/5/10 or 20/5/12 framework) is acceptable if and only if you still put 20% down and commit to keeping the car for at least 7 to 8 years (giving yourself 2 to 3 years with zero car payments). Compare what each household income bracket can safely afford under both frameworks (assuming $280/month reserved for insurance and fuel, leaving the remainder of the monthly budget for the loan payment at 6.35% APR):
| Gross Annual Household Income | Gross Monthly Income | Max Loan Payment (Strict 10% All-In Cap) | Max Car Price: Strict 20/4/10 (48 Mo) | Max Loan Payment (Modern 12% All-In Cap) | Max Car Price: Modern 20/5/12 (60 Mo) |
|---|---|---|---|---|---|
| $54,000 / yr | $4,500 / mo | $170 / mo ($450 − $280) | $8,993 (Cash car tier) | $260 / mo ($540 − $280) | $16,670 (Used sedan) |
| $72,000 / yr | $6,000 / mo | $320 / mo ($600 − $280) | $16,930 (Used Civic/Corolla) | $440 / mo ($720 − $280) | $28,210 (New compact / CPO SUV) |
| $90,000 / yr | $7,500 / mo | $470 / mo ($750 − $280) | $24,865 (New Corolla / Mazda3) | $620 / mo ($900 − $280) | $39,750 (New CR-V / RAV4 Hybrid) |
| $114,000 / yr | $9,500 / mo | $670 / mo ($950 − $280) | $35,445 (New Compact SUV) | $860 / mo ($1,140 − $280) | $55,138 (Midsize 3-Row SUV) |
| $144,000 / yr | $12,000 / mo | $920 / mo ($1,200 − $280) | $48,672 (Avg New US Car) | $1,160 / mo ($1,440 − $280) | $74,373 (Full-Size Truck / Luxury) |
What to Do When Your Commute Requires a Reliable Car on a $60,000 Income
To be completely candid, showroom peer pressure wrecks middle-class budgets. Look at the $54,000 to $72,000 income rows above: when insurance and fuel already eat $280 a month, buying a $38,000 new SUV on a $65,000 salary devours 20%+ of take-home pay and starves every other financial goal. Instead of stretching into an 84-month subprime note on a new crossover, target the sweet spot of the US depreciation curve: a 3- to 4-year-old compact or midsize sedan (such as a Mazda3, Honda Civic, Toyota Corolla, or Subaru Impreza/Legacy) priced between $17,500 and $21,500.
With $3,500 down on an $18,500 three-year-old sedan ($15,000 financed over 48 months at 6.8% APR in our Car Loan Calculator), your monthly payment is just $357.82, your fuel bill at 35 MPG is under $100/month, and your loan is completely paid off in four years, freeing up $4,300 a year in cash flow to invest or save for your next car in cash.