
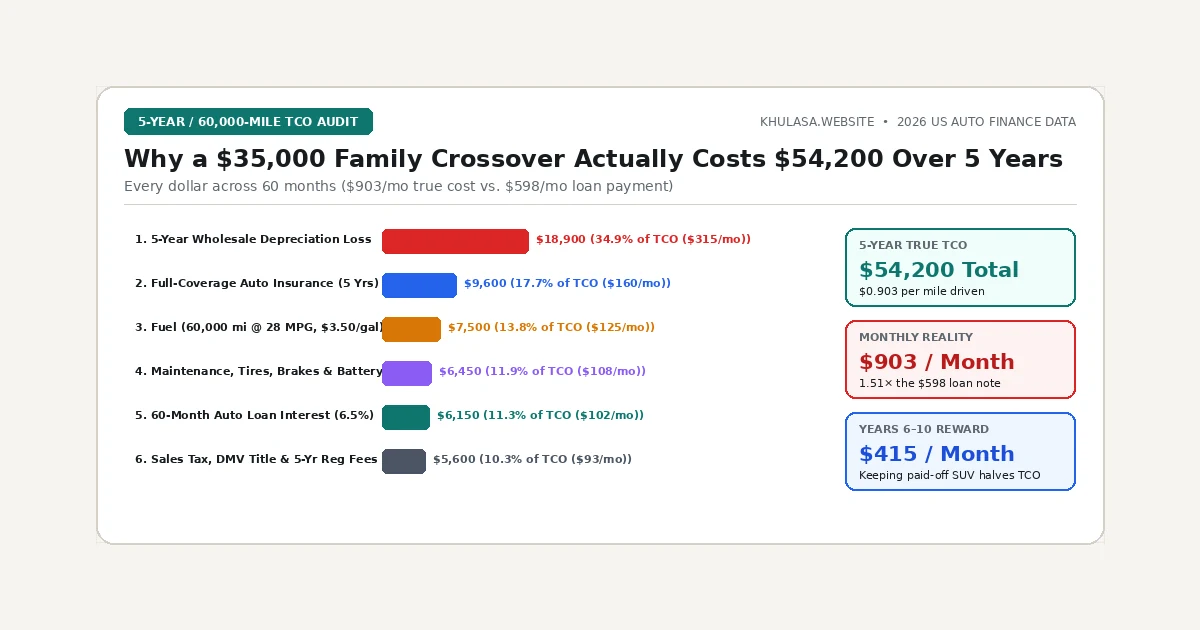
In our reader audit files from Columbus, Ohio, a 2026 compact all-wheel-drive crossover purchase stands out because the buyers did almost everything right at the dealership. They negotiated a clean $35,000 selling price on a family SUV (in the Honda CR-V EX-L, Subaru Forester Limited, and Toyota RAV4 XLE class), put $4,500 cash down to cover Ohio's 7.25% sales tax ($2,537.50), $462.50 in title and doc fees, and $1,500 toward principal, and financed $33,500 for 60 months at 6.35% APR. Their monthly loan payment came out to $653.15.
The household budgeted around "$653 a month plus gas." That math rarely holds up over five years. When Elena and I audited every dollar of operating outflow and wholesale depreciation across 60 months and 60,000 miles in our Total Cost of Car Ownership Calculator and cross-checked against Bureau of Labor Statistics (BLS) household transportation expenditure data and EPA FuelEconomy.gov fuel benchmarks, their true five-year net economic TCO reached $47,367 ($789.45/month), with $54,215 in gross cash leaving their checking account before resale.
Year-by-Year 5-Year Ownership Ledger ($35,000 AWD Crossover, 12,000 Miles/Year)
To see why vehicle ownership costs accelerate in Years 3, 4, and 5 even while your loan payment stays flat, examine the year-by-year ledger below (modeled at 28 MPG, $3.50/gal fuel, and a 13.5% compound annual depreciation rate):
| Expense Category | Year 1 (0–12k Mi) | Year 2 (12k–24k Mi) | Year 3 (24k–36k Mi) | Year 4 (36k–48k Mi) | Year 5 (48k–60k Mi) | 5-Year Total (% of TCO) |
|---|---|---|---|---|---|---|
| 1. Annual Value Depreciation (Ends at $16,947 Resale) |
$4,725 | $4,087 | $3,535 | $3,058 | $2,648 | $18,053 (41.5%) |
| 2. Gasoline (28 MPG @ $3.50/gal) | $1,500 | $1,500 | $1,500 | $1,500 | $1,500 | $7,500 (17.2%) |
| 3. Full-Coverage Insurance | $1,720 | $1,760 | $1,800 | $1,820 | $1,840 | $8,940 (20.5%) |
| 4. Maintenance, Tires & Brakes | $190 (Oil/rotations) | $310 (Oil + air filters) | $680 (30k fluids + battery) | $1,390 (4 new tires + oil) | $1,120 (Front/rear brakes + 60k service) | $3,690 (8.5%) |
| 5. Sales Tax, Doc, Title & Reg | $3,000 (Upfront tax/doc/plate) | $95 (Renewal) | $95 (Renewal) | $95 (Renewal) | $95 (Renewal) | $3,380 (7.8%) |
| 6. Auto Loan Interest Paid ($5,689 total; $3,712 if $25k note) |
$1,982 | $1,598 | $1,188 | $751 | $285 | $5,804 (13.3%) |
| Annual Net Economic TCO | $13,117 | $9,350 | $8,898 | $8,614 | $6,368 | $47,367 Net TCO |
The Three Biggest Takeaways From the 5-Year Ledger
1. Year 1 Is Nearly Twice as Expensive as Year 5 ($13,117 vs. $6,368)
Year one is a financial sledgehammer. Look at the bottom row of the ledger: Year 1 costs the household $13,117 ($1,093/month in true economic cost!) because Year 1 absorbs the $3,000 upfront sales tax and registration hit, the steepest $4,725 first-year depreciation drop, and the highest $1,982 front-loaded loan interest year. By Year 5, even though the car needs a $1,120 brake and 60,000-mile fluid service, annual depreciation has fallen to $2,648 and annual loan interest has dropped to just $285, cutting total Year 5 ownership cost to $6,368 ($530/month).
2. Why Trading In at Year 5 Throws Away Your Cheapest Driving Years (Years 6–9)
Just as the Millers make their 60th loan payment, put four brand-new tires and fresh brakes on the car, and watch their annual depreciation drop below $2,200/year, dealership marketing letters arrive in the mail urging them to trade the paid-off 60,000-mile crossover in for a brand-new 2031 model, restarting the $13,117 Year-1 cycle all over again!
If the Millers instead keep their paid-off crossover for Years 6, 7, and 8 (from 60,000 to 96,000 miles), their loan interest is $0, their sales tax is $0, their average annual depreciation drops to $1,850/year, and even with $1,150/year set aside via our Car Maintenance Cost Calculator, their total cost of ownership during Years 6–8 averages just $6,300/year ($525/month all-in, or $0.525/mile), saving the family over $14,500 in net wealth across those three debt-free years.
3. How to Cut $7,200 Off This Exact 5-Year Crossover Budget
Small adjustments save thousands here. In our own testing of household fleet budgets, you do not have to drive a bare-bones subcompact to dramatically lower your five-year TCO. Three tactical moves cut $7,200+ off the ledger above on the exact same class of vehicle:
- Buy a 2-Year-Old Off-Lease / CPO Example ($27,800 instead of $35,000): Letting the first owner absorb the $8,812 depreciation drop of Years 1 and 2 saves roughly $4,900 in net 5-year depreciation and $635 in sales tax.
- Shop Insurance 60 Days Before Renewal & Raise Collision Deductibles from $250 to $1,000: Moving from a $250 collision/comprehensive deductible to a $1,000 deductible (backed by an emergency fund) and re-quoting across three carriers typically trims $320 to $480 per year ($1,600 to $2,400 over 5 years).
- Use Independent Brand-Specialist Shops After Warranty Expiration: Having 30,000- and 60,000-mile fluid, brake, and tire work performed at a trusted independent Japanese/domestic specialist and major tire retailer rather than the dealership service lane saves 30% to 40% ($1,100 over 5 years). Read our companion guide on navigating the 30k, 60k, and 100k-mile maintenance cliffs.
Cash-Flow Cost vs. Net Economic TCO: Why Both Numbers Matter
When building a household budget, you have to track two separate metrics simultaneously: Monthly Cash-Flow Outflow (what leaves your checking account each month while the loan is active) and Net Economic TCO (which replaces principal loan payments with actual wholesale depreciation lost).
During Years 1 through 5, your checking account feels the heavier Cash-Flow Outflow because you are paying off the entire $33,500 loan balance down to $0 while the vehicle still retains $16,947 in equity at Month 60. Recognizing that $16,947 residual asset is critical, because keeping the vehicle into Years 6, 7, and 8 lets you harvest that stored equity in the form of zero car payments.